How it works
Most finance apps start with your transactions. Promi starts with you.
We model what your finances should look like before we ever see a transaction. Then your real money shows where the model is right, and where you're not. The same approach a financial planner uses, automated.
The architectural difference
Reactive apps describe your past. Promi predicts what your present should be.
Every finance app since Mint works the same way: pull in your transactions, categorize them, show you what happened. It can tell you that you spent $812 on groceries last month. Is that a lot for a dual-income family with a kid in your area? It has no idea. That answer was never in your transactions, which is also why budgets fail: one built from your own history just re-approves whatever you already do.
Financial planners work differently. They start with a few facts about you, build a picture of what a household like yours should look like, and check your reality against it. Promi is the first consumer app built the same way.
Step 1
Tell us about you.
Five facts, under a minute. The same intake a financial planner runs.
Where you live, solo or partner, ages and kids, an income range, and a rough picture of what you own. Your ZIP sets a cost-of-living tier. Income and state set the tax math. Age and household shape pick your life stage and your peer group.
No account connected and no transactions ingested, and you already have your first answer: how your income, debt, and net worth sit against households like yours, before you have linked a single account.
Household Profile
Self reportedthe real product component · figures from a realistic sample household
Step 2
Statistics and rules, not guesses.
Census and BLS spending surveys set the baseline. Federal tax brackets and ZIP-level cost of living scale it to your area and income. Statistics about households like yours, never data about you.
Before Promi has seen a single transaction, it can show you what a household like yours typically earns, pays in taxes, puts into a 401k, and holds in assets, debt, and net worth. That is the Local Average column: your metro, your age group, real progressive-bracket tax math, sitting next to your own numbers from day one.
The same statistics pre-fill your budget. On the budget page it is the GUIDE column: a suggested amount for every category, built from BLS spending surveys for your income tier and scaled to your metro's cost of living. Promi's numbers come with a “says who.”
Financial Summary
2026 vs Local Average
How we calculate Local Average
The “Local Average” column shows typical finances for households in your age group in the Austin, Texas metro area, adjusted for local cost of living. Tax estimates use a $133,000 median household income (15.7% effective rate) with standard deductions for your filing status. Data last refreshed Jul 7, 2026.
| Metric | 20262026 (proj.) | LocalLocal Average |
|---|---|---|
| Income (HHI) | $235k$235,000 | $133k$133,000 |
| Pre-tax 401k | $28k$28,200 | $8k$7,980 |
| Taxable Income | $207k$206,800 | $125k$125,020 |
| $47k$46,690 | $21k$20,920 | |
| Effective Tax Rate | 19.9% | 15.7% |
| Net Take-Home | $160k$160,110 | $104k$104,100 |
| + Employer Match | $0$0 | $5k$5,320 |
| Balance Sheet | ||
| Total Assets | $769k$769,000 | $610k$610,000 |
| Total Debt | $345k$345,000 | $285k$285,000 |
| Net Worth | $424k$424,000 | $325k$325,000 |
the real product component · Local Average computed live from the statistical model
Step 3
Connect your accounts in one click.
12,000+ institutions via Plaid. Live transaction sync, with nothing to import by hand.
Most apps stop here and call it tracking. Promi treats this step as the input to the next one: your real bank data is the ground truth the model gets measured against.
Read-only access, and we never move your money.
Add an account
The real dialog from the app. Pick a route to see what happens next.
Step 4
Reality meets the model, and you see where you stand.
This is the step nobody else does. We compare what you actually spent, earned, and accumulated against what the model predicted for someone in your life stage.
Your real spending goes next to what households at your income and cost of living typically spend, and your net-worth trajectory next to the 25th, 50th, and 75th percentile of households like yours. That is the comparison a planner gets paid for.
Because it runs on trailing data, a lumpy month (the annual premium, a December) does not break it.
Peer Benchmark
30sDual income1 childHomeownerYour net worth is 2.2× your peer group.
Figures from a realistic sample household. Promi places you against your cohort on day one, before a single transaction syncs.
Step 5
Retirement and FIRE are already built.
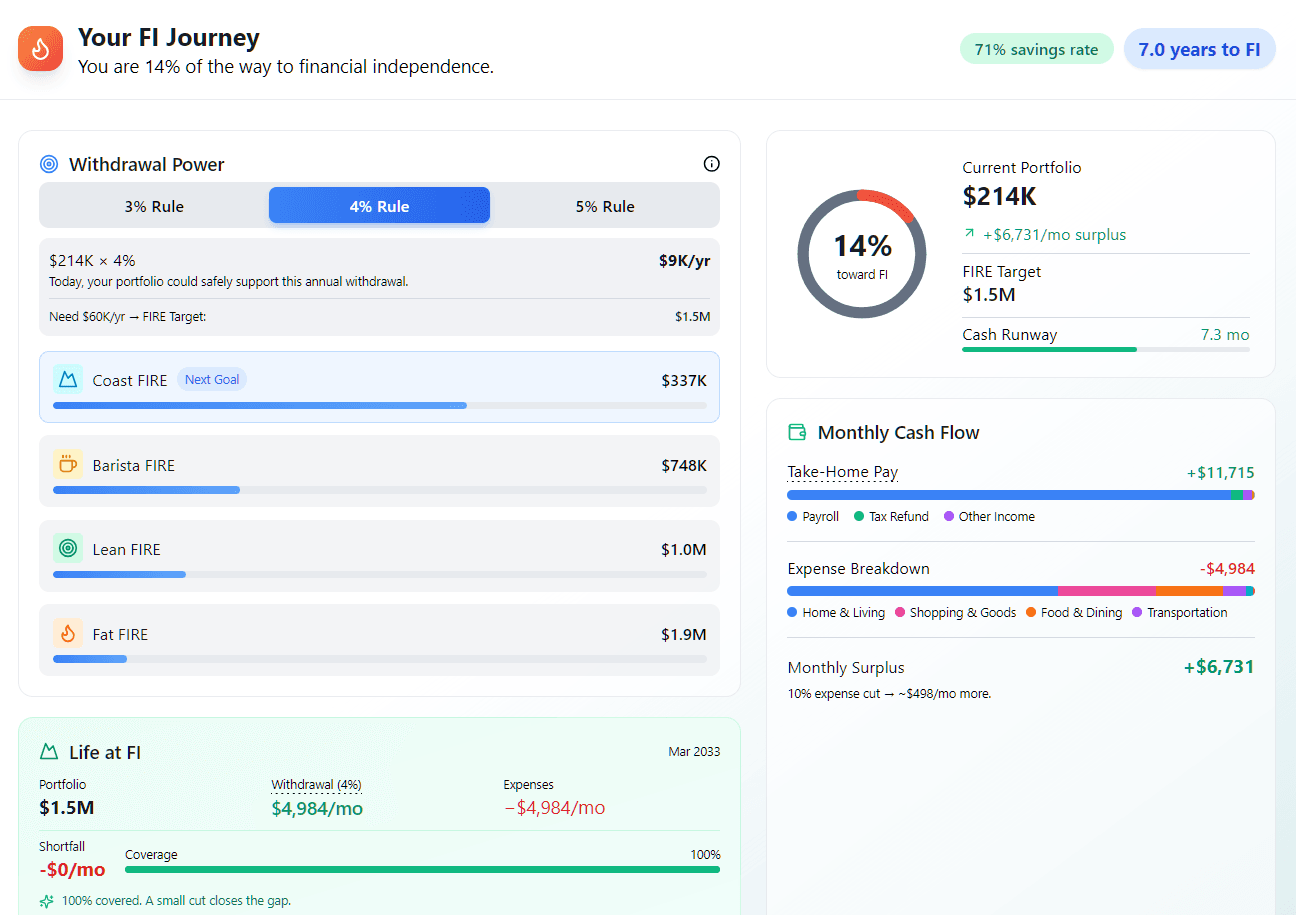
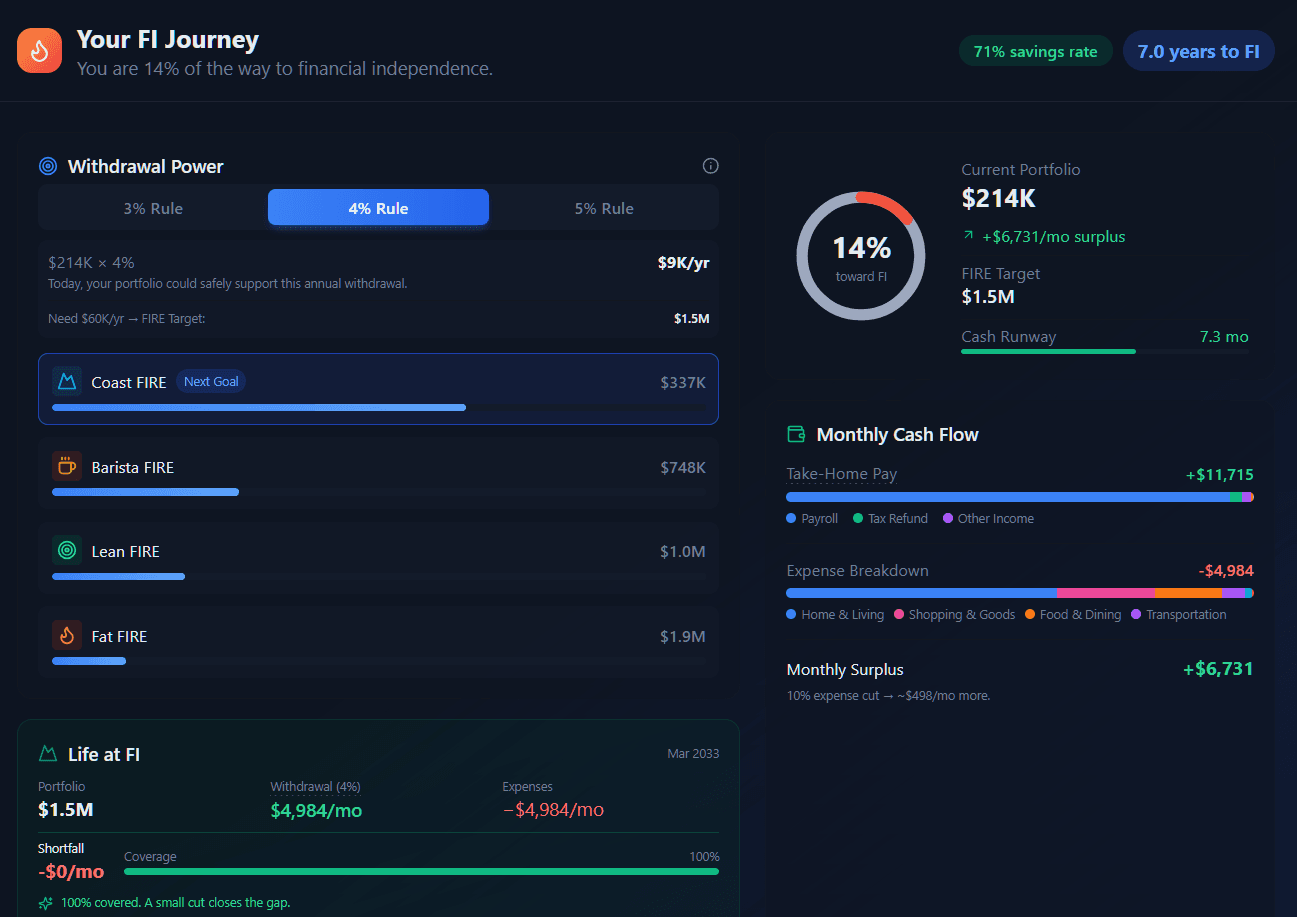
By the time you've done steps 1 through 4, the retirement and FIRE math is already there. Same data, different horizon.
Everything from steps 1 through 4 flows into one projection engine: 1,000-run Monte Carlo simulations, Social Security modeled on the real PIA formula, five FIRE variants with a configurable withdrawal rate. All of it computed in today's dollars with a real tax engine, not a flat 7% line to age 90.
What it replaces
The architecture a financial planner uses. Automated. For the cost of a subscription.
A fee-only planner runs this same loop by hand, in a spreadsheet, a few times a year, and charges about $3,000 a year to keep it current.
Competitor prices checked against their own pages on September 4, 2026.
See it for yourself
No sign-up required. Explore the full app with realistic demo data: the model, the verification loop, the FIRE projections, all of it.
Open the live demo